Visualizing Graphs with GraphViz

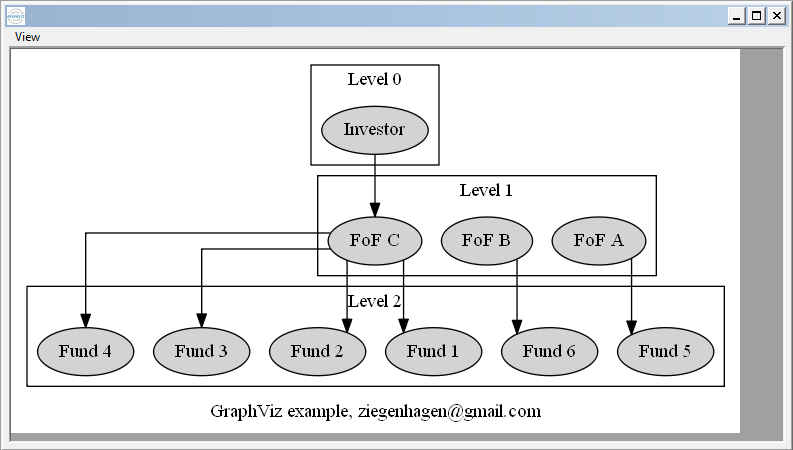
Here’s a nice example of GraphViz visualizing Fund structures.

digraph G {
graph [label="GraphViz example", splines=ortho, nodesep=0.2]
                subgraph cluster_ {
                                node [style=filled];
                                i0;
                                label = "Level 0";
                }
 
                subgraph cluster_0 {
                                node [style=filled];
                                a0  a1  a2;
                                label = "Level 1";
                }
 
                subgraph cluster_1 {
                                node [style=filled];
                                rank=same;
                                b0 b1 b2 b3 b4 b5;
                                label = "Level 2";
                }
                
                i0 [label="Investor"];
                a0 [label="FoF A"];
                a1 [label="FoF B"];
                a2 [label="FoF C"];
                b0 [label="Fund 1"];
                b1 [label="Fund 2"];
                b2 [label="Fund 3"];
                b3 [label="Fund 4"];
                b4 [label="Fund 5"];
                b5 [label="Fund 6"];
                
                i0->a2;
                a0->b4;
                a1->b5;
                a2->b0;
                a2->b1;
                a2->b2;
                a2->b3;
}

gv-01

Uwe

Uwe Ziegenhagen likes LaTeX and Python, sometimes even combined. Do you like my content and would like to thank me for it? Consider making a small donation to my local fablab, the Dingfabrik Köln. Details on how to donate can be found here Spenden für die Dingfabrik.

More Posts - Website