Subgraphs with Graphviz
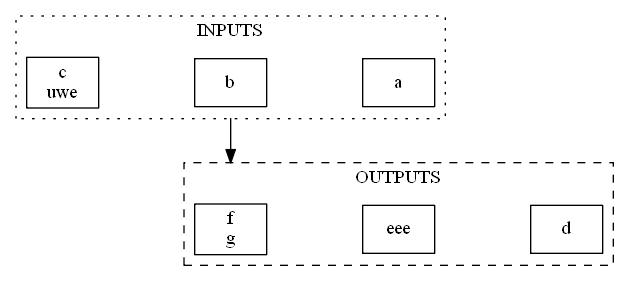
Currently I am trying to find a way to visualize all BABoK inputs and outputs in one diagram. Graphviz is the way to go for this task. The following diagram is a simple example how to create different clusters of subgraphs and connecting them.
digraph g{
splines=ortho;
nodesep=1;
ranksep=1;
node [shape=box];
compound=true;

subgraph cluster0 {
  	node [shape=box]
	a23 [label="a"];
	b [label="b"];
	c [label="c\nTest"];
	label="INPUTS";
	graph[style=dotted];
}
subgraph cluster1 {
	d [label="d"];
	e [label="eee"];
	f [label="f\ng"];
	label="OUTPUTS";
	graph[style=dashed];
}

b -> f[ltail=cluster0,lhead=cluster1];
}