Archive for the ‘R’ Category.

Syntaxhighlighting mit Pygments und LaTeX

Hier ein Beispiel, wie man aus LaTeX-Dateien heraus a) Dateien schreibt b) diese Dateien durch einen externen Interpreter (in diesem Fall Python) ausführen lässt, c) die Ergebnisse wieder in TeX anzeigt und d) dabei das Syntax-Highlighting durch pygments erledigen lässt.

Wichtig: --shell-escape muss aktiviert sein, eine Python-Distribution (ich bevorzuge Anaconda) muss installiert sein, Python im Pfad sein.

Das Beispiel lässt sich leicht auf alle anderen Sprachen ausweiten, die im Batch-Verfahren ausführbar sind.

English: The following example shows how one can write code for external interpreters directly in LaTeX. During compilation the code is written to external files, run be the interpreter, its results stored in the corresponding .plog output file. Syntax hightlighting is done via pygments. --shell-escape must be set for the TeX-compiler!

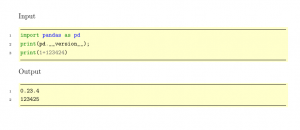
\documentclass[12pt]{scrartcl}
\usepackage[utf8]{inputenc}
\usepackage[T1]{fontenc}
\usepackage{xcolor}
 
\definecolor{colBack}{rgb}{1,1,0.8}
 
\usepackage{minted}
 
\setminted[python]{frame=lines, framesep=2mm, baselinestretch=1.2, bgcolor=colBack,fontsize=\footnotesize,linenos}
\setminted[text]{frame=lines, framesep=2mm, baselinestretch=1.2, bgcolor=colBack,fontsize=\footnotesize,linenos}
 
\usepackage{fancyvrb}
 
\makeatletter
\newenvironment{pycode}[1]%
  {\xdef\d@tn@me{#1}\xdef\r@ncmd{python #1.py > #1.plog}%
  \typeout{Writing file #1}\VerbatimOut{#1.py}% 
  }
  {\endVerbatimOut %
 \toks0{\immediate\write18}%
 \expandafter\toks\expandafter1\expandafter{\r@ncmd}%
 \edef\d@r@ncmd{\the\toks0{\the\toks1}}\d@r@ncmd %
 \noindent Input
 \inputminted{python}{\d@tn@me.py}%
 \noindent Output
 \inputminted{text}{\d@tn@me.plog}%
}
\makeatother
 
 
\begin{document}
 
\begin{pycode}{abc}
import pandas as pd
print(pd.__version__);
print(1+123424)
\end{pycode}
 
 
\end{document}

Uwe

Uwe Ziegenhagen likes LaTeX and Python, sometimes even combined. Do you like my content and would like to thank me for it? Consider making a small donation to my local fablab, the Dingfabrik Köln. Details on how to donate can be found here Spenden für die Dingfabrik.

More Posts - Website

Computing Confidence Intervals with R

To highlight how confidence intervals cover in 1-\alpha cases the true parameter I hacked together a little R code based on code from http://paleocave.sciencesortof.com/2013/03/writing-a-for-loop-in-r/ and http://www.cyclismo.org/tutorial/R/confidence.html

  • I define a function which takes as parameter „runs“ the number of confidence intervals to compute
  • result is the vector of results, it will contain TRUE values for those intervals that cover the true parameter and FALSE for those which don’t
  • for each run I draw a sample of 10000 points from N(0,1)
  • I then calculate the mean and standard deviation of the sample
  • before calculating the limits of the confidence interval, „left“ and „right“
  • Since I know the true mu is 0 I can check if 0 falls into this interval, the result of this check is stored in the i-th column of the result vector
  • finally I calculate the summary of the result vector. On average 95% percent of all intervals will cover the true mu, 0.

If I find some more time I will add some functionality to run this code on multiple cores as well as a graphical visualisation of the intervals.

confInt <- function(runs){
	result<-NULL
	for (i in 1:runs) {
		data<-rnorm(10000)
		n<-length(data)
		a<-mean(data)
		s<-sd(data)
		error <- qnorm(0.975)*s/sqrt(n)
		left <- a-error
		right <- a+error
		result[i] = left<0 & 0<right
	}
	result
}
summary(confInt(100))

EDIT: Using some more ggplot2 code I have the graphical visualization ready:

confInt <- function(runs){
	x<-1:runs
	mu<-NULL
	sigma<-NULL
	result<-NULL
	vleft<-NULL
	vright<-NULL
 
	for (i in 1:runs) {
		data<-rnorm(1000)
		n<-length(data)
		a<-mean(data)
		mu[i]<-a
		s<-sd(data)
		sigma[i]<-s
		error <- qnorm(0.975)*s/sqrt(n)
		left <- a-error
		right <- a+error
 
		result[i] = left<0 & 0<right
		vleft[i] = left	
		vright[i] = right
}
	data.frame(x,mu,sigma,result,vleft,vright)
}
 
 
df<-confInt(100)
 
require(ggplot2)
 
myplot<-ggplot(df, aes(x = x, y = mu)) +
  geom_point(size = 2) +
  geom_errorbar(aes(ymax = vleft, ymin = vright,colour=result*3))
myplot + theme_bw() 
summary(df)

See http://stackoverflow.com/questions/30289894/plotting-confidence-intervals-from-a-dataframe/30290123#30290123 for an alternative solution.

Uwe

Uwe Ziegenhagen likes LaTeX and Python, sometimes even combined. Do you like my content and would like to thank me for it? Consider making a small donation to my local fablab, the Dingfabrik Köln. Details on how to donate can be found here Spenden für die Dingfabrik.

More Posts - Website

Building a Raspberry Pi 2cluster

This entry is part 1 of 5 in the series Raspberry Cluster

Big Data, Hadoop, NumPy, R cluster computing etc. are pretty hot topics. To get my hands on them and get a deeper understanding I have decided to build my own cluster out of small Raspberry Pi 2 computers. I am not the first one to come up with this idea, you can find a few nice examples online.

I have decided to use five Raspberry Pi 2 and one Banana Pi in this cluster. The Banana Pi has the advantage of being equipped with a Serial ATA port, my plan is to use it to store the data the Raspberries are working on.

The general setup is the following:

  1. 5 x Raspberry Pi 2 from Pollin for 37.95 Euro each
  2. A TP-Link 8-Port Gigabit Switch for 20.99 Euro
  3. a 6-Port RAVpower USB power source (3 x 1.0 Amp, 3 x 2.4 Amp) for 17.99 Euro
  4. a couple of five micro USB cables for 12.99 Euro
  5. Identical 16 GB micro-SD cards from Sandisk, Class 10 for 10.99 each
  6. the Banana Pi (I got mine from notebooksbilliger.de for 33.89 Euro)
  7. a SATA Power/Data cable to connect a 2.5″ harddisk to the Banana Pi

So altogether I spent around 320 for the electronic parts, some other parts (like SD card and USB cable for the Banana Pi) I had in my stash.

In the next article of this series I’ll describe the case I am currently building out of Lego Technics parts…

Uwe

Uwe Ziegenhagen likes LaTeX and Python, sometimes even combined. Do you like my content and would like to thank me for it? Consider making a small donation to my local fablab, the Dingfabrik Köln. Details on how to donate can be found here Spenden für die Dingfabrik.

More Posts - Website

Pie-Charts mit R und ggplot2

Here’s a simple example how to create a pie-chart (in PDF format) with R’s ggplot2 library.

pdf(file = "g:/test.pdf")
library("ggplot2")

df <- data.frame(
  Legende = c("male", "female", "child"),
  werte = c(20, 20,60)
)

blue <- rgb(26/255, 115/255, 186/255, 1) 
yellow <- rgb(255/255, 219/255, 67/255, 1) 
orange <- rgb(181/255, 75/255, 5/255, 1)

ggplot(df, aes(x = "", y = werte, fill = Legende)) +
	geom_bar(width = 1, stat = "identity") +
  	scale_fill_manual(values =  c(blue, yellow, orange)) +
  	coord_polar("y", start = 0) +
	labs(title = "Ein einfacher Pie-Chart")  +
	xlab("X-Achse") +
	ylab("Y-Achse") 
  
dev.off()

pie1

Uwe

Uwe Ziegenhagen likes LaTeX and Python, sometimes even combined. Do you like my content and would like to thank me for it? Consider making a small donation to my local fablab, the Dingfabrik Köln. Details on how to donate can be found here Spenden für die Dingfabrik.

More Posts - Website

Dynamische Reports mit R

Vor kurzem hat mich jemand gefragt, wie man denn mit R Reports dynamisch gestalten könne. Ausgehend von Erfahrungen, die ich damals beim automatisierten Textsatz eines Konferenzprogramms sammeln konnte, war die Lösung nicht schwer.

Ausgangspunkt ist eine CSV Datei, die über das RSQLite Paket in eine in-memory Datenbank geladen wird. Auf des Basis dieser Datenbank werden dann ein paar SQL-Statements aufgebaut, die dann beliebig ausgewertet werden können.

# read excel table from csv to dataframe
df = read.table("g:/datasource.csv",sep=";",header=TRUE)
 
# set up plot window
par(mfrow = c(3,2))
 
# load SQlite library
library("RSQLite")
 
# create fresh database in memory
db <- dbConnect(SQLite(),dbname=".memory.")
 
# write dataframe to database
dbWriteTable(db, "kpi", df) 
 
# list all tables in db 
dbListTables(db)
 
# get a vector of all departments
departments = dbGetQuery(db, "Select distinct(department) from kpi")
 
 
for(i in 1:nrow(departments)){
	print(paste("Department",departments[i,1],sep=" "))
	statement = paste("Select distinct(manager) from kpi where department='",departments[i,1],"'",sep="")
	# print(statement)
	manager = dbGetQuery(db, statement)
 
	for(j in 1:nrow(manager)){
		print(paste("Manager",manager[j,1],sep=" "))
		statement = paste("Select distinct(employee) from kpi where department='",departments[i,1],"'"," and manager='",manager[j,1],"'",sep="")
		# print(statement)
		employee = dbGetQuery(db, statement)
 
		for(k in 1:nrow(employee)){
			print(paste("Employee",employee[k,1],sep=" "))
			statement = paste("Select kpi1,kpi2,kpi3 from kpi where department='",departments[i,1],"'"," and manager='",manager[j,1],"' and employee='",employee[k,1],"'",sep="")
			# print(statement)
			fulldata_employee = dbGetQuery(db, statement)
			# print(fulldata_employee)
			x <- c(1,2,3)
			plot(x,fulldata_employee,type="l",main=paste(departments[i,1],manager[j,1],employee[k,1],sep=" "))
		}
	}
}
 
dbDisconnect(db)

R

Uwe

Uwe Ziegenhagen likes LaTeX and Python, sometimes even combined. Do you like my content and would like to thank me for it? Consider making a small donation to my local fablab, the Dingfabrik Köln. Details on how to donate can be found here Spenden für die Dingfabrik.

More Posts - Website

R unter Ubuntu aktualisieren

Hier eine kurze Zusammenfassung (ausführlich unter http://cran.r-project.org/bin/linux/ubuntu/), wie man unter Ubuntu seine R Installation aktualisiert:

  1. Import des PGP Keys via gpg --keyserver keyserver.ubuntu.com --recv-key E084DAB9
  2. Bereitstellung für apt über gpg -a --export E084DAB9 | sudo apt-key add -
  3. Einfügen des CRAN Mirrors in die /etc/apt/sources.list: deb http://ftp5.gwdg.de/pub/misc/cran/bin/linux/ubuntu oneiric/
  4. sudo apt-get update
  5. sudo apt-get upgrade

Uwe

Uwe Ziegenhagen likes LaTeX and Python, sometimes even combined. Do you like my content and would like to thank me for it? Consider making a small donation to my local fablab, the Dingfabrik Köln. Details on how to donate can be found here Spenden für die Dingfabrik.

More Posts - Website

Levenshtein mit R und der RecordLinkage Bibliothek

Mit RecordLinkagegibt es eine R Bibliothek, die den Levenshtein Algorithmus per DLL/SO bereitstellt. Hier ein Beispiel:

library("RecordLinkage")

# the absolute value of the Levenshtein distance
levenshteinDist("Uwe", "uwe")
# a similarity measure
# based on 1 - d(str1,str2) / max(A,B)
# with d as L. distance
# and A, B as lengths of strings
levenshteinSim("Uwe", "uwe")

Uwe

Uwe Ziegenhagen likes LaTeX and Python, sometimes even combined. Do you like my content and would like to thank me for it? Consider making a small donation to my local fablab, the Dingfabrik Köln. Details on how to donate can be found here Spenden für die Dingfabrik.

More Posts - Website

Minards Karte des Napoleonischen Russland-Feldzugs

Charles Joseph Minard war ein französischer Bauingenieur, dessen Karte der napoleonischen Verluste während des Russland-Feldzugs auch heute noch als eine der besten Visualisierungen gilt. Auf der folgenden Webseite findet man mehr Informationen dazu http://www.math.yorku.ca/SCS/Gallery/re-minard.html.

Uwe

Uwe Ziegenhagen likes LaTeX and Python, sometimes even combined. Do you like my content and would like to thank me for it? Consider making a small donation to my local fablab, the Dingfabrik Köln. Details on how to donate can be found here Spenden für die Dingfabrik.

More Posts - Website

Google Visualisation API mit R nutzen

Mit googleVis gibt es ein interessantes Paket für R, mit dem man aus R heraus die Visualisierungs-API von Google nutzen kann.

http://code.google.com/p/google-motion-charts-with-r/

Uwe

Uwe Ziegenhagen likes LaTeX and Python, sometimes even combined. Do you like my content and would like to thank me for it? Consider making a small donation to my local fablab, the Dingfabrik Köln. Details on how to donate can be found here Spenden für die Dingfabrik.

More Posts - Website

Slides „R and Sweave“

English Slides for my talk on R and Sweave.

Slides

TUGboat Article (preliminary version)

Please note that I will update these slides until the end of July.

Uwe

Uwe Ziegenhagen likes LaTeX and Python, sometimes even combined. Do you like my content and would like to thank me for it? Consider making a small donation to my local fablab, the Dingfabrik Köln. Details on how to donate can be found here Spenden für die Dingfabrik.

More Posts - Website