Posts tagged ‘Pandas’

SQL Inserts auf die clevere Art erzeugen mit pandas

Hier ein cleveres Beispiel aus dem Internet (Quelle habe ich leider nicht mehr) dafür, wie man mit pandas einfach SQL Inserts erzeugen kann. In der Datei Daten.csv finden sich die einzufügenden Daten zusammen mit den entsprechenden Spaltennamen der Datenbanktabelle.

Über df.columns bekommen wir dann beim Insert die benötigten Spaltennamen aus dem DataFrame geliefert, über das Tuple der Zeilenwerte row.values die einzufügenden Werte.

import pandas as pd
 
df = pd.read_csv('Daten.csv', sep=';', decimal=',')
 
with open('Statements2.sql', 'w') as o:
    for index, row in df.iterrows():
        o.write('INSERT INTO aaaaaa('+ str(', '.join(df.columns))+ ') VALUES '+ str(tuple(row.values))+';\n')

Uwe

Uwe Ziegenhagen likes LaTeX and Python, sometimes even combined. Do you like my content and would like to thank me for it? Consider making a small donation to my local fablab, the Dingfabrik Köln. Details on how to donate can be found here Spenden für die Dingfabrik.

More Posts - Website

XML-Dateien mit Python, pandas und Jinja2 befüllen

Angenommen, wir haben eine Excel-Datei Daten.xlsx mit Werten, die in ein entsprechendes XML-Dokument überführt werden müssen.

Mit Python und der Jinja2 Template-Engine ist das flink gemacht. Zuerst definieren wir das Template template.xml:

<?xml version='1.0' encoding='UTF-8'?>
	<table name="Tablename">
	{% for _,row in data.iterrows() %}
	<ROW>
    <COLUMN1>{{row['column1']}}</COLUMN1>
    <COLUMN2>{{row['column2']}}</COLUMN2>
    <COLUMN3>{{row['column3']}}</COLUMN3>
	</ROW>
	{% endfor %}
</table>

Dann definieren wir den Python-Code:

import pandas as pd # data wrangling
import jinja2 # template engine
import os # for file-related stuff
 
# create jinja env that can load template from filesystem
jinja_env = jinja2.Environment(loader = jinja2.FileSystemLoader(os.path.abspath('.')))
 
df = pd.read_excel('Daten.xlsx')
template = jinja_env.get_template('template.xml')
 
with open('FertigesXML.xml','w') as output:
    output.write(template.render(data=df))

Lassen wir den Python-Code laufen, so erhalten wir das folgende XML:

Uwe

Uwe Ziegenhagen likes LaTeX and Python, sometimes even combined. Do you like my content and would like to thank me for it? Consider making a small donation to my local fablab, the Dingfabrik Köln. Details on how to donate can be found here Spenden für die Dingfabrik.

More Posts - Website

Reading the ECB fx rates file with Python (pandas)

A while ago (https://www.uweziegenhagen.de/?p=2373) I had an article on how to read the ECB fx rates file with Python. Some time has passed, there are other options in Python 3.

Option 1: Make the Python 2 code run with Python 3

import xml.etree.ElementTree as ET
import urllib.request 
 
root = ET.parse(urllib.request.urlopen('http://www.ecb.europa.eu/stats/eurofxref/eurofxref-daily.xml')).getroot()
 
for child in root[2][0]:
    curr = child.get('currency')
    rate = child.get('rate')
    print(curr, rate)

Option 2: Use pandas >=1.3

Starting with version 1.3 pandas offers the read_xml command, so upgrade using
pip3 install --upgrade pandas or conda update pandas.

from urllib.request import urlopen
import pandas as pd
 
df = pd.read_xml(urlopen('http://www.ecb.europa.eu/stats/eurofxref/eurofxref-daily.xml'),xpath='//*[@currency]')
 
print(df)

Uwe

Uwe Ziegenhagen likes LaTeX and Python, sometimes even combined. Do you like my content and would like to thank me for it? Consider making a small donation to my local fablab, the Dingfabrik Köln. Details on how to donate can be found here Spenden für die Dingfabrik.

More Posts - Website

CSV-Dateien effizient vergleichen mit pandas

Hier ein bisschen Python-Code, um zwei CSV Dateien miteinander zu vergleichen. Die Ergebnisse des spalten- und zeilenweisen Vergleichs werden dann zusammengefasst dargestellt, um schnell einen Überblick zu bekommen, wo eine tiefergehende Analyse notwendig ist.

import sys
import collections
import pandas as pd
from tabulate import tabulate
 
 
file1 = pd.read_csv('file1.csv', sep=';', encoding='UTF-8')
file2 = pd.read_csv('file2.csv', sep=';', encoding='UTF-8')
 
columnnames1 = list(file1)
columnnames2 = list(file2)
 
if collections.Counter(columnnames1) == collections.Counter(columnnames2):
    print ("Number of columns and Names match, Comparison possible...\n\n")
else:
    print ("Number of columns and Names are not matching!!! Please check the input!")
    sys.exit('Error!')
 
# add suffixes to distinguish between actual and expected in the merger
file1 = file1.add_suffix('_e') # expected
file2 = file2.add_suffix('_t') # t
 
 
# merge them using the given key, use outer join
comparison = pd.merge(file1,file2, how='outer',
                      left_on=['Key_e'],
                      right_on=['Key_t'])
 
# create the columnwise comparison
for col in columnnames1:
    comparison[(col + '_c')] = comparison[(col + '_t')] == comparison[(col + '_e')]
 
# reorder the columns
comparison=comparison.reindex(sorted(comparison.columns),axis=1)
 
print(tabulate(comparison, tablefmt="pipe", headers="keys"))
 
 
# save the result as Excel file
comparison.to_excel('result.xlsx')
 
# names of the comparison column
check_colnames= [s + '_c' for s in columnnames1]
 
# initialize an empty dataframe for the log
logdf=pd.DataFrame(index=[True,False])
 
for column in check_colnames:
    t=comparison[column].value_counts() # returns a series
    tt=pd.DataFrame(t) # makes a DF out of the series
    logdf = logdf.join(tt,how='outer') # join the two dfs
 
# transpose for better readability
logdf = logdf.transpose()
 
# Ensure fixed sequence of the columns
logdf=logdf.reindex(sorted(logdf.columns),axis=1)
 
# write to disk
logdf.to_excel('logfile.xlsx')
 
# for better viewing on the screen
logdf.fillna('-',inplace=True)
pd.options.display.float_format = '{:,.0f}'.format
 
print(tabulate(logdf, tablefmt="pipe", headers="keys"))

Uwe

Uwe Ziegenhagen likes LaTeX and Python, sometimes even combined. Do you like my content and would like to thank me for it? Consider making a small donation to my local fablab, the Dingfabrik Köln. Details on how to donate can be found here Spenden für die Dingfabrik.

More Posts - Website

Mit StringIO Python-Objekte als Datei nutzen

Im Beitrag „CSV-Dateien mit speziellen Spaltentrennern in Python laden“ hatte ich gezeigt, wie man mit BS4 Dateien aus Webseiten extrahieren und abspeichern kann, um sie dann in pandas weiterzuverarbeiten. Es geht auch ohne den Umweg der CSV-Datei, wenn man die StringIO Klasse aus dem io Modul nutzt.

Wir laden das Modul und instanziieren dann ein Objekt der Klasse mit dem von BS4 gefundenen Datensatz. Diese Objekt wird dann anstelle des Pfades der CSV-Datei an die pd.read_csv() Funktion übergeben.

import pandas as pd
import requests
from bs4 import BeautifulSoup
from io import StringIO
 
headers = {
    'Access-Control-Allow-Origin': '*',
    'Access-Control-Allow-Methods': 'GET',
    'Access-Control-Allow-Headers': 'Content-Type',
    'Access-Control-Max-Age': '3600',
    'User-Agent': 'Mozilla/5.0 (X11; Ubuntu; Linux x86_64; rv:52.0) Gecko/20100101 Firefox/52.0'
}
 
url = "http://www.statistics4u.com/fundstat_eng/data_fluriedw.html"
req = requests.get(url, headers)
soup = BeautifulSoup(req.content, 'html.parser')
 
data=soup.find('pre').contents[0]
 
str_object = StringIO(data)
 
df = pd.read_csv(str_object,engine='python',skiprows=5,delim_whitespace=True)
print(df)

Uwe

Uwe Ziegenhagen likes LaTeX and Python, sometimes even combined. Do you like my content and would like to thank me for it? Consider making a small donation to my local fablab, the Dingfabrik Köln. Details on how to donate can be found here Spenden für die Dingfabrik.

More Posts - Website

CSV-Dateien mit speziellen Spaltentrennern in Python laden

Um einige Klassifikations-Algorithmen in Python ausprobieren zu können habe ich heute die Swiss Banknote Data von Flury und Riedwyl benötigt. Die Daten sind im Netz z.B. unter http://www.statistics4u.com/fundstat_eng/data_fluriedw.html verfügbar, ich wollte sie aber nicht manuell einladen müssen.

Mit dem folgenden Code, adaptiert von https://hackersandslackers.com/scraping-urls-with-beautifulsoup/, kann man die Daten lokal abspeichern und dann in einen pandas Dataframe einladen.

import pandas as pd
import requests
from bs4 import BeautifulSoup
 
headers = {
    'Access-Control-Allow-Origin': '*',
    'Access-Control-Allow-Methods': 'GET',
    'Access-Control-Allow-Headers': 'Content-Type',
    'Access-Control-Max-Age': '3600',
    'User-Agent': 'Mozilla/5.0 (X11; Ubuntu; Linux x86_64; rv:52.0) Gecko/20100101 Firefox/52.0'
}
 
url = "http://www.statistics4u.com/fundstat_eng/data_fluriedw.html"
req = requests.get(url, headers)
soup = BeautifulSoup(req.content, 'html.parser')
 
a=soup.find('pre').contents[0]
 
with open('banknote.csv','wt') as data:
    data.write(a)
 
df = pd.read_csv('banknote.csv',engine='python',skiprows=5,delim_whitespace=True)
print(df)

Uwe

Uwe Ziegenhagen likes LaTeX and Python, sometimes even combined. Do you like my content and would like to thank me for it? Consider making a small donation to my local fablab, the Dingfabrik Köln. Details on how to donate can be found here Spenden für die Dingfabrik.

More Posts - Website

pandas auf der GPU

Mit cudf gibt es ein Paket, das pandas Datenstrukturen auf nvidia-Grafikkarten verarbeiten kann. Einen i7 3770 mit 24 GB RAM habe ich jetzt mit einer CUDA-fähigen Grafikkarte (Typ Quadro P400) ausgestattet, damit ich damit rumspielen arbeiten kann. Unter https://towardsdatascience.com/heres-how-you-can-speedup-pandas-with-cudf-and-gpus-9ddc1716d5f2 findet man passende Beispiele, diese habe ich in einem Jupyter-Notebook laufenlassen.

Ein Geschwindigkeitszuwachs ist erkennbar, insbesondere bei der Matrix-Größe aus dem verlinkten Beispiel war die CUDA-Variante mehr als 3x so schnell wie die CPU-Variante. Das Merge mit der vollen Matrix-Größe lief bei mir leider nicht, da limitieren vermutlich die 2 GB RAM, die die P400 bietet.

Uwe

Uwe Ziegenhagen likes LaTeX and Python, sometimes even combined. Do you like my content and would like to thank me for it? Consider making a small donation to my local fablab, the Dingfabrik Köln. Details on how to donate can be found here Spenden für die Dingfabrik.

More Posts - Website

Mit Python suchen und ersetzen in CSV-Dateien (mit pandas)

Nachdem wir uns im letzten Artikel angeschaut hatten, wie man mit openpyxl Funktionen Felder in CSV-Dateien mit Werten aus Excel-Dateien ersetzen kann, heute nun die pandas Implementierung dessen.

Sie nutzt auch openpyxl zum Einlesen der Excel-Datei, da xlrd, das bisher von pandas genutzte Modul für Excel-Dateien, den Support für XLSX Formate eingestellt hat.

Die Arbeitsweise des Codes ist recht einfach. pandas liest die Datei, da die Tabelle nicht links oben anfängt, werden die erste Zeile und Spalte ignoriert und die Spalten passend benannt. Dann iterieren wird durch den Dataframe und ersetzen munter…

import pandas as pd
 
path = "python_test.xlsx"
df = pd.read_excel(path,engine='openpyxl',
                   sheet_name='Tabelle2',skiprows=1,
                   usecols={1,2},header=None)
 
df = df.rename(columns={1: "Key", 2: "Value"})
 
with open('Python_test.txt') as input_file:
    text = input_file.read()
 
    for index, row in df.iterrows():
        text = text.replace(row['Key'] ,str(row['Value']))
 
    with open('Python_test_output_pd.txt','w') as output_file:
        output_file.write(text)

Uwe

Uwe Ziegenhagen likes LaTeX and Python, sometimes even combined. Do you like my content and would like to thank me for it? Consider making a small donation to my local fablab, the Dingfabrik Köln. Details on how to donate can be found here Spenden für die Dingfabrik.

More Posts - Website

Nordwind-DB mit Python abfragen (Python, pandas, MySQL)

Hier ein einfaches Beispiel, wie man die Daten aus der Nordwind-Datenbank in einen pandas Dataframe bekommt. Der originale Code stammt von https://pythontic.com/pandas/serialization/mysql und wurde auf meine Datenbank angepasst.

# -*- coding: utf-8 -*-
 
from sqlalchemy import create_engine
import pymysql
import pandas as pd
 
sqlEngine       = create_engine('mysql+pymysql://nwread:northwind@192.168.0.60/northwind', pool_recycle=3600)
dbConnection    = sqlEngine.connect()
frame           = pd.read_sql("select * from products", dbConnection);
 
pd.set_option('display.expand_frame_repr', False)
print(frame)
 
frame.to_excel('r:/abc.xlsx')
 
dbConnection.close()

Uwe

Uwe Ziegenhagen likes LaTeX and Python, sometimes even combined. Do you like my content and would like to thank me for it? Consider making a small donation to my local fablab, the Dingfabrik Köln. Details on how to donate can be found here Spenden für die Dingfabrik.

More Posts - Website

Excel-Dateien schreiben mit Openpyxl: (Bedingte) Formatierung

This entry is part 6 of 6 in the series Openpyxl

Mit Openpyxl lassen sich auch Zellformatierungen und bedingte Formatierungen setzen. Das folgende Beispiel formatiert die ersten beiden Spalten grün, wenn der Zellwert „1“ beträgt und rot für alle anderen Inhalte. Die dritte Spalte wird mit blauem Hintergrund formatiert, hier jedoch ohne Bedingung.

import pandas as pd
import numpy as np
from openpyxl import Workbook
from openpyxl.utils.cell import get_column_letter
from openpyxl.utils.dataframe import dataframe_to_rows
from openpyxl.worksheet.table import Table, TableStyleInfo
 
from openpyxl.styles import Color, PatternFill, Font, Border
from openpyxl.formatting.rule import ColorScaleRule, CellIsRule, FormulaRule, Rule
 
 
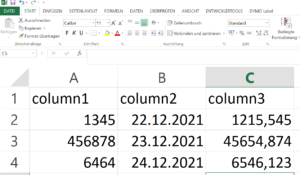
dataframe = pd.DataFrame(np.array([[1, 2, 3], [4, 5, 6], [7, 8, 9]]), columns=['a', 'b', 'c'])
rows = dataframe_to_rows(dataframe, index=False, header=True)
 
wb = Workbook()
ws = wb.active
 
for r_idx, row in enumerate(rows, 1):
    for c_idx, value in enumerate(row, 1):
        ws.cell(row=r_idx, column=c_idx, value=value)
 
# Set column widths based on title width or fixed number
widths = {}
for column in ws.columns:
    if column[0].value is None: # no column header => Fixed with
        widths[column[0].column] = 10.5
    else: # if column header is present => min width resp. maximum
        widths[column[0].column] = max(len(str(column[0].value)) * 1.45, 10.5)
 
ws.column_dimensions[get_column_letter(column[0].column)].width = widths[column[0].column]
 
# Insert formatted table from A1 to max column/max row
tab = Table(displayName="MeineTabelle", ref='A1:' + get_column_letter(ws.max_column) + str(ws.max_row))
style = TableStyleInfo(name="TableStyleLight9", showFirstColumn=False,
                       showLastColumn=False, showRowStripes=True, showColumnStripes=True)
tab.tableStyleInfo = style
ws.add_table(tab)
 
# conditional formatting
redFill = PatternFill(start_color='EE1111',end_color='EE1111',fill_type='solid')
greenFill = PatternFill(start_color='EE1111',end_color='11EE11',fill_type='solid')
ws.conditional_formatting.add('A2:B'+str(ws.max_row),CellIsRule(operator='equal', formula=[1], stopIfTrue=True, fill=greenFill))
ws.conditional_formatting.add('A2:B'+str(ws.max_row),CellIsRule(operator='notEqual', formula=[1], stopIfTrue=True, fill=redFill))
 
lightbluefill = PatternFill(start_color='CCCCFF',end_color='CCCCFF',fill_type='solid')
 
for rowNum in range(2, ws.max_row + 1):
    ws.cell(row=rowNum, column=3).fill = lightbluefill
 
wb.save('07.xlsx')
wb.close()

Uwe

Uwe Ziegenhagen likes LaTeX and Python, sometimes even combined. Do you like my content and would like to thank me for it? Consider making a small donation to my local fablab, the Dingfabrik Köln. Details on how to donate can be found here Spenden für die Dingfabrik.

More Posts - Website