2015-05-17, 16:55
To highlight how confidence intervals cover in 1-\alpha cases the true parameter I hacked together a little R code based on code from http://paleocave.sciencesortof.com/2013/03/writing-a-for-loop-in-r/ and http://www.cyclismo.org/tutorial/R/confidence.html
- I define a function which takes as parameter „runs“ the number of confidence intervals to compute
- result is the vector of results, it will contain TRUE values for those intervals that cover the true parameter and FALSE for those which don’t
- for each run I draw a sample of 10000 points from N(0,1)
- I then calculate the mean and standard deviation of the sample
- before calculating the limits of the confidence interval, „left“ and „right“
- Since I know the true mu is 0 I can check if 0 falls into this interval, the result of this check is stored in the i-th column of the result vector
- finally I calculate the summary of the result vector. On average 95% percent of all intervals will cover the true mu, 0.
If I find some more time I will add some functionality to run this code on multiple cores as well as a graphical visualisation of the intervals.
confInt <- function(runs){
	result<-NULL
	for (i in 1:runs) {
		data<-rnorm(10000)
		n<-length(data)
		a<-mean(data)
		s<-sd(data)
		error <- qnorm(0.975)*s/sqrt(n)
		left <- a-error
		right <- a+error
		result[i] = left<0 & 0<right
	}
	result
}
summary(confInt(100)) |
confInt <- function(runs){
result<-NULL
for (i in 1:runs) {
data<-rnorm(10000)
n<-length(data)
a<-mean(data)
s<-sd(data)
error <- qnorm(0.975)*s/sqrt(n)
left <- a-error
right <- a+error
result[i] = left<0 & 0<right
}
result
}
summary(confInt(100))
EDIT: Using some more ggplot2 code I have the graphical visualization ready:
confInt <- function(runs){
	x<-1:runs
	mu<-NULL
	sigma<-NULL
	result<-NULL
	vleft<-NULL
	vright<-NULL

	for (i in 1:runs) {
		data<-rnorm(1000)
		n<-length(data)
		a<-mean(data)
		mu[i]<-a
		s<-sd(data)
		sigma[i]<-s
		error <- qnorm(0.975)*s/sqrt(n)
		left <- a-error
		right <- a+error

		result[i] = left<0 & 0<right
		vleft[i] = left
		vright[i] = right
}
	data.frame(x,mu,sigma,result,vleft,vright)
}


df<-confInt(100)

require(ggplot2)

myplot<-ggplot(df, aes(x = x, y = mu)) +
  geom_point(size = 2) +
  geom_errorbar(aes(ymax = vleft, ymin = vright,colour=result*3))
myplot + theme_bw()
summary(df) |
confInt <- function(runs){
x<-1:runs
mu<-NULL
sigma<-NULL
result<-NULL
vleft<-NULL
vright<-NULL
for (i in 1:runs) {
data<-rnorm(1000)
n<-length(data)
a<-mean(data)
mu[i]<-a
s<-sd(data)
sigma[i]<-s
error <- qnorm(0.975)*s/sqrt(n)
left <- a-error
right <- a+error
result[i] = left<0 & 0<right
vleft[i] = left
vright[i] = right
}
data.frame(x,mu,sigma,result,vleft,vright)
}
df<-confInt(100)
require(ggplot2)
myplot<-ggplot(df, aes(x = x, y = mu)) +
geom_point(size = 2) +
geom_errorbar(aes(ymax = vleft, ymin = vright,colour=result*3))
myplot + theme_bw()
summary(df)
See http://stackoverflow.com/questions/30289894/plotting-confidence-intervals-from-a-dataframe/30290123#30290123 for an alternative solution.
Uwe Ziegenhagen likes LaTeX and Python, sometimes even combined.
Do you like my content and would like to thank me for it? Consider making a small donation to my local fablab, the Dingfabrik Köln. Details on how to donate can be found here Spenden für die Dingfabrik.
More Posts - Website
2013-11-17, 00:35
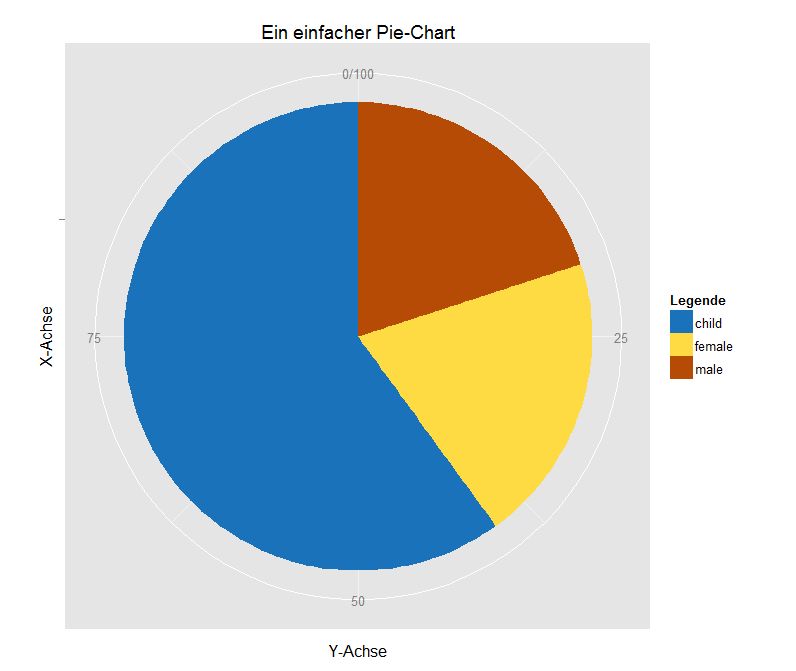
Here’s a simple example how to create a pie-chart (in PDF format) with R’s ggplot2 library.
pdf(file = "g:/test.pdf")
library("ggplot2")

df <- data.frame(
  Legende = c("male", "female", "child"),
  werte = c(20, 20,60)
)

blue <- rgb(26/255, 115/255, 186/255, 1)
yellow <- rgb(255/255, 219/255, 67/255, 1)
orange <- rgb(181/255, 75/255, 5/255, 1)

ggplot(df, aes(x = "", y = werte, fill = Legende)) +
	geom_bar(width = 1, stat = "identity") +
  	scale_fill_manual(values =  c(blue, yellow, orange)) +
  	coord_polar("y", start = 0) +
	labs(title = "Ein einfacher Pie-Chart")  +
	xlab("X-Achse") +
	ylab("Y-Achse")

dev.off()
Uwe Ziegenhagen likes LaTeX and Python, sometimes even combined.
Do you like my content and would like to thank me for it? Consider making a small donation to my local fablab, the Dingfabrik Köln. Details on how to donate can be found here Spenden für die Dingfabrik.
More Posts - Website
Schlagwörter:
pie_chart,
R Category:
R |
Kommentare deaktiviert für Pie-Charts mit R und ggplot2
2010-03-06, 23:47
Mit Sweave lässt sich R Code direkt in LaTeX Dokumente einbetten und ausführen. Dokumente lassen sich auf diese Weise sehr einfach automatisieren und dynamisieren. Ein weiterer Vorteil ist, dass auch immer die richtigen Grafiken und Tabellen im TeX Dokument landen.
Auf der 42. Dante Tagung in Dortmund habe ich zu dem Thema einen kurzen Vortrag gehalten, hier sind die Folien: uweziegenhagen-dante2010
Uwe Ziegenhagen likes LaTeX and Python, sometimes even combined.
Do you like my content and would like to thank me for it? Consider making a small donation to my local fablab, the Dingfabrik Köln. Details on how to donate can be found here Spenden für die Dingfabrik.
More Posts - Website
Schlagwörter:
LaTeX,
Statistik,
R Category:
LaTeX,
R |
Kommentare deaktiviert für Folien für meinen Sweave-Vortrag
2009-12-26, 10:42
Anfang 2009 war ein interessanter Artikel zu R in der NY Times: http://www.nytimes.com/2009/01/07/technology/business-computing/07program.html?_r=3.
Uwe Ziegenhagen likes LaTeX and Python, sometimes even combined.
Do you like my content and would like to thank me for it? Consider making a small donation to my local fablab, the Dingfabrik Köln. Details on how to donate can be found here Spenden für die Dingfabrik.
More Posts - Website
Schlagwörter:
R Category:
Statistik & Zahlen |
Kommentare deaktiviert für Artikel zu R in der NY Times