Pie-Charts mit R und ggplot2
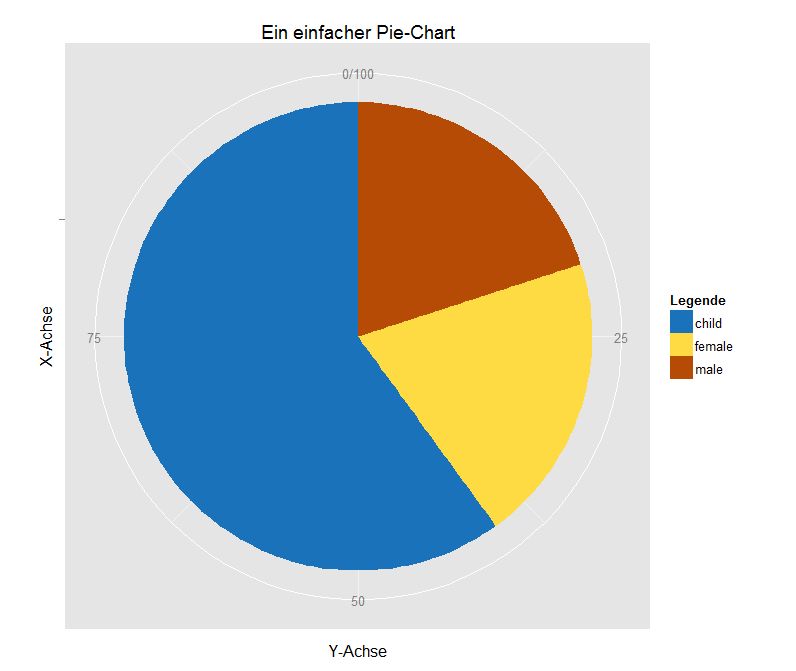
Here’s a simple example how to create a pie-chart (in PDF format) with R’s ggplot2 library.
pdf(file = "g:/test.pdf")
library("ggplot2")

df <- data.frame(
  Legende = c("male", "female", "child"),
  werte = c(20, 20,60)
)

blue <- rgb(26/255, 115/255, 186/255, 1)
yellow <- rgb(255/255, 219/255, 67/255, 1)
orange <- rgb(181/255, 75/255, 5/255, 1)

ggplot(df, aes(x = "", y = werte, fill = Legende)) +
	geom_bar(width = 1, stat = "identity") +
  	scale_fill_manual(values =  c(blue, yellow, orange)) +
  	coord_polar("y", start = 0) +
	labs(title = "Ein einfacher Pie-Chart")  +
	xlab("X-Achse") +
	ylab("Y-Achse")

dev.off()