2015-05-24, 20:00
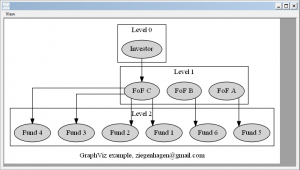
Here’s a nice example of GraphViz visualizing Fund structures.
digraph G {
graph [label="GraphViz example", splines=ortho, nodesep=0.2]
                subgraph cluster_ {
                                node [style=filled];
                                i0;
                                label = "Level 0";
                }

                subgraph cluster_0 {
                                node [style=filled];
                                a0  a1  a2;
                                label = "Level 1";
                }

                subgraph cluster_1 {
                                node [style=filled];
                                rank=same;
                                b0 b1 b2 b3 b4 b5;
                                label = "Level 2";
                }

                i0 [label="Investor"];
                a0 [label="FoF A"];
                a1 [label="FoF B"];
                a2 [label="FoF C"];
                b0 [label="Fund 1"];
                b1 [label="Fund 2"];
                b2 [label="Fund 3"];
                b3 [label="Fund 4"];
                b4 [label="Fund 5"];
                b5 [label="Fund 6"];

                i0->a2;
                a0->b4;
                a1->b5;
                a2->b0;
                a2->b1;
                a2->b2;
                a2->b3;
}
Uwe Ziegenhagen likes LaTeX and Python, sometimes even combined.
Do you like my content and would like to thank me for it? Consider making a small donation to my local fablab, the Dingfabrik Köln. Details on how to donate can be found here Spenden für die Dingfabrik.
More Posts - Website
Schlagwörter:
Graphviz Category:
Allgemein |
Kommentare deaktiviert für Visualizing Graphs with GraphViz
2014-02-02, 21:10
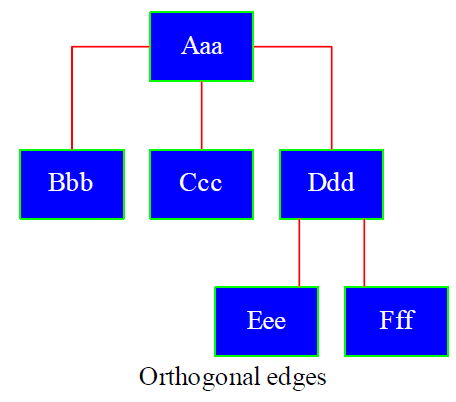
In this article I’d like to show a little bit about how to manipulate the style of the nodes and edges.
The graph uses orthogonal edges, red edges and green boxes with blue filling and white font color.
digraph G{
graph [label="Orthogonal edges", splines=ortho, nodesep=0.2]
node [shape=box,style=filled,fillcolor="#0000FF",color="#00FF00",fontcolor="#FFFFFF"];
edge[arrowhead="none",color="#FF0000"];
a [label="Aaa",URL="http://www.google.de"];
b [label="Bbb"];
c [label="Ccc"];
d [label="Ddd"];
e [label="Eee"];
f [label="Fff"];
a->b;
a->c;
a->d;
d->e;
d->f;
}
Note that the URL can only be used in the SVG version, the PDF representation does not support it.
Uwe Ziegenhagen likes LaTeX and Python, sometimes even combined.
Do you like my content and would like to thank me for it? Consider making a small donation to my local fablab, the Dingfabrik Köln. Details on how to donate can be found here Spenden für die Dingfabrik.
More Posts - Website
Schlagwörter:
LaTeX,
Graphviz Category:
LaTeX |
Kommentare deaktiviert für Visualizing Graphs mit Graphviz (and LaTeX) – Part II
2013-06-01, 09:42
This is the first article in a series to describe Graphviz, an amazing tool to generate org charts and relationship diagrams, and ways to work with it from LaTeX. (I need to compile a huge set of slides so my intention is to save some time by automating the process)
I knew of its existence for quite a while but never managed to take anough time to get a closer look. Driven by my job however (the setup of a Private Equity fund of funds involves different legal entities) I decided to give it a try.
Graphviz was developed at the famous AT&T labs and released under Eclipse Public License. It consists of a set of binary tools that are able tranform Graphviz’s description language DOT into graphics.
Until further notice I will use dot, one of the binaries, to transform the examples into PNG. There are other converters like neato, which differ from dot in the way they calculate the distances between the nodes, etc.
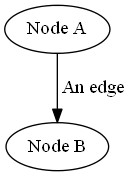
Working with Graphviz involves defining nodes and edges between them. See the following, non-minimal example. I use a digraph (other types like e.g. graph are available but I didn’t look up the differences so far), define two nodes a and b and and edge between them.
digraph G{
a [label="Node A"];
b [label="Node B"];
a->b[label=" An edge"];
}
Using the command dot -Tpng nameoffile.gv I get the following PNG:
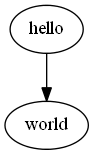
The above example is a bit more sophisticated than the minimal working example:
digraph G{
hello->world;
}
Uwe Ziegenhagen likes LaTeX and Python, sometimes even combined.
Do you like my content and would like to thank me for it? Consider making a small donation to my local fablab, the Dingfabrik Köln. Details on how to donate can be found here Spenden für die Dingfabrik.
More Posts - Website
