2017-03-14, 07:59
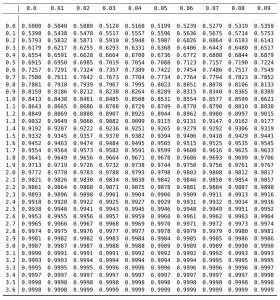
Here’s a simple example how one can generate a normal distribution table with Python and scipy so that it can be imported into LaTeX.
Example-03.zip
# -*- coding: utf-8 -*-
"""
Created on Mon Mar 13 21:14:17 2017
@author: Uwe Ziegenhagen, ziegenhagen@gmail.com

Creates a CDF table for the standard normal distribution

use booktabs package in the preamble and put
the generated numbers inside (use only one backslash!)

\\begin{tabular}{r|cccccccccc} \\toprule
<output here>
\\end{tabular}
"""

from scipy.stats import norm

print(norm.pdf(0))
print(norm.cdf(0),'\r\n')

horizontal = range(0,10,1)
vertikal = range(0,37)

header = ''
for i in horizontal:
    header = header + '& ' + str(i/100)

print(header, '\\\\ \\midrule')

for j in vertikal:
    x = j/10
    print('\\\\', x)
    for i in horizontal:
        y = x + i/100
        print('& ', "{:10.4f}".format(norm.cdf(y),4))


print('\\\\ \\bottomrule \r\n') |
# -*- coding: utf-8 -*-
"""
Created on Mon Mar 13 21:14:17 2017
@author: Uwe Ziegenhagen, ziegenhagen@gmail.com
Creates a CDF table for the standard normal distribution
use booktabs package in the preamble and put
the generated numbers inside (use only one backslash!)
\\begin{tabular}{r|cccccccccc} \\toprule
<output here>
\\end{tabular}
"""
from scipy.stats import norm
print(norm.pdf(0))
print(norm.cdf(0),'\r\n')
horizontal = range(0,10,1)
vertikal = range(0,37)
header = ''
for i in horizontal:
header = header + '& ' + str(i/100)
print(header, '\\\\ \\midrule')
for j in vertikal:
x = j/10
print('\\\\', x)
for i in horizontal:
y = x + i/100
print('& ', "{:10.4f}".format(norm.cdf(y),4))
print('\\\\ \\bottomrule \r\n')
Uwe Ziegenhagen likes LaTeX and Python, sometimes even combined.
Do you like my content and would like to thank me for it? Consider making a small donation to my local fablab, the Dingfabrik Köln. Details on how to donate can be found here Spenden für die Dingfabrik.
More Posts - Website
2016-08-24, 21:27
Here are my slides from the Froscon 2016 presentation „Using Python for Scientific Research“.
Slides: Froscon_Slides_2016
Video: Video Recording (The screen was flickering most of the time, pretty annoying and distracting)
I will continously update and expand this presentation during the next months, if you want to receive updates follow the GitHub repository: https://github.com/UweZiegenhagen/2016-Python-Data-Analysis-Slides/
Uwe Ziegenhagen likes LaTeX and Python, sometimes even combined.
Do you like my content and would like to thank me for it? Consider making a small donation to my local fablab, the Dingfabrik Köln. Details on how to donate can be found here Spenden für die Dingfabrik.
More Posts - Website