2021-12-23, 20:35
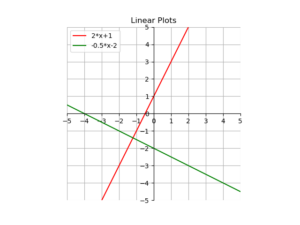
Hier ein kurzes Beispiel, wie man mit matplotlib Funktionen plotten kann.
import matplotlib.pyplot as plt
import numpy as np

ax = plt.gca()
plt.gca().set_aspect('equal')

ax.set_xticks(range(-6,6,1))
ax.set_yticks(range(-6,6,1))
ax.set_xlim([-5, 5])
ax.set_ylim([-5, 5])

ax.spines['top'].set_color('none')
ax.spines['bottom'].set_position('zero')
ax.spines['left'].set_position('zero')
ax.spines['right'].set_color('none')

x = np.linspace(-5,5,100)
y = 2*x+1
y2 = -0.5*x-2

plt.plot(x, y,  'r', label='2*x+1')
plt.plot(x, y2, 'g', label='-0.5*x-2')

plt.title('Linear Plots')

plt.legend(loc='upper left')

plt.grid()
plt.show() |
import matplotlib.pyplot as plt
import numpy as np
ax = plt.gca()
plt.gca().set_aspect('equal')
ax.set_xticks(range(-6,6,1))
ax.set_yticks(range(-6,6,1))
ax.set_xlim([-5, 5])
ax.set_ylim([-5, 5])
ax.spines['top'].set_color('none')
ax.spines['bottom'].set_position('zero')
ax.spines['left'].set_position('zero')
ax.spines['right'].set_color('none')
x = np.linspace(-5,5,100)
y = 2*x+1
y2 = -0.5*x-2
plt.plot(x, y, 'r', label='2*x+1')
plt.plot(x, y2, 'g', label='-0.5*x-2')
plt.title('Linear Plots')
plt.legend(loc='upper left')
plt.grid()
plt.show()
Uwe Ziegenhagen likes LaTeX and Python, sometimes even combined.
Do you like my content and would like to thank me for it? Consider making a small donation to my local fablab, the Dingfabrik Köln. Details on how to donate can be found here Spenden für die Dingfabrik.
More Posts - Website