Archive for the ‘Programmierung’ Category.
2022-09-18, 13:45
Hier ein cleveres Beispiel aus dem Internet (Quelle habe ich leider nicht mehr) dafür, wie man mit pandas einfach SQL Inserts erzeugen kann. In der Datei Daten.csv finden sich die einzufügenden Daten zusammen mit den entsprechenden Spaltennamen der Datenbanktabelle.
Über df.columns bekommen wir dann beim Insert die benötigten Spaltennamen aus dem DataFrame geliefert, über das Tuple der Zeilenwerte row.values die einzufügenden Werte.
import pandas as pd

df = pd.read_csv('Daten.csv', sep=';', decimal=',')

with open('Statements2.sql', 'w') as o:
    for index, row in df.iterrows():
o.write('INSERT INTO aaaaaa('+ str(', '.join(df.columns))+ ') VALUES '+ str(tuple(row.values))+';\n') |
import pandas as pd
df = pd.read_csv('Daten.csv', sep=';', decimal=',')
with open('Statements2.sql', 'w') as o:
for index, row in df.iterrows():
o.write('INSERT INTO aaaaaa('+ str(', '.join(df.columns))+ ') VALUES '+ str(tuple(row.values))+';\n')
Uwe Ziegenhagen likes LaTeX and Python, sometimes even combined.
Do you like my content and would like to thank me for it? Consider making a small donation to my local fablab, the Dingfabrik Köln. Details on how to donate can be found here Spenden für die Dingfabrik.
More Posts - Website
2022-07-09, 18:47
Der folgende Trick hat mir einige Klimmzüge erspart. In einer Textdatei gab es an diversen Stellen mehrfache Leerzeichen, die ich durch ein einzelnes ersetzen wollte.
Ich hätte jetzt einfach so lange doppelte Leerzeichen durch ein einzelnes ersetzen können, bis keine doppelten Leerzeichen mehr vorhanden sind, über einen regular expression geht es aber viel eleganter.
import re

s = 'a     b     c'

print(re.sub('\s+',' ',s)) |
import re
s = 'a b c'
print(re.sub('\s+',' ',s))
Uwe Ziegenhagen likes LaTeX and Python, sometimes even combined.
Do you like my content and would like to thank me for it? Consider making a small donation to my local fablab, the Dingfabrik Köln. Details on how to donate can be found here Spenden für die Dingfabrik.
More Posts - Website
2022-06-27, 21:02
Ich hatte vor kurzem das Problem (oder die „Challenge“), einen sehr komplexen Cognos-Report anpassen zu müssen. In mehreren dutzend Formeln mussten Formeln angepasst werden, den Formel-Check zur Prüfung meiner Anpassungen konnte ich jedoch nicht nutzen, da die Datenüberprüfung unendlich lang gedauert hätte (schlechtes Report-Design…).
Mit Python gab es aber eine einfache und elegante Lösung, die mit dem Export des Report-Designs in eine XML-Datei begann.
In der XML-Datei fanden sich dann Schnipsel wie
<expression>abs(total((if ([Database].[storedProc].[ColumnID]=6) then ([Database].[storedProc].[Amount]) else (0))))</expression>
Mit dem folgenden Programm-Code konnte ich dann innerhalb der expression-Tags einfach die öffnenden und schließenden Klammern zählen. Wenn die Zahl der öffnenden Klammern nicht der Zahl der schließenden Klammern entsprach, war die Formel noch falsch.
import re
buffer = open('./Report.xml','r').read()

results = re.findall(r"(<expression>)(.*)(</expression>)",buffer,re.MULTILINE)

for result in results:
    expression = result[1]
    opened = expression.count('(')
    closed = expression.count(')')

    if opened != closed:
print(expression) |
import re
buffer = open('./Report.xml','r').read()
results = re.findall(r"(<expression>)(.*)(</expression>)",buffer,re.MULTILINE)
for result in results:
expression = result[1]
opened = expression.count('(')
closed = expression.count(')')
if opened != closed:
print(expression)
Uwe Ziegenhagen likes LaTeX and Python, sometimes even combined.
Do you like my content and would like to thank me for it? Consider making a small donation to my local fablab, the Dingfabrik Köln. Details on how to donate can be found here Spenden für die Dingfabrik.
More Posts - Website
2022-06-27, 20:47
Nehmen wir mal an, wir haben eine Excel-Datei Daten.xlsx mit Namen, in der es Fehleingaben durch beispielsweise einen Buchstabendreher geben kann:
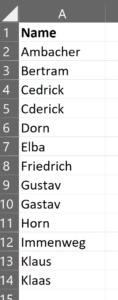
Mit Python und dem Levenshtein-Paket können wir die Ähnlichkeit der Namen recht einfach prüfen.
import pandas as pd
import Levenshtein

df = pd.read_excel('Daten.xlsx')
df = df.sort_values(by=['Name'])
df = df.reset_index(drop=True)

dfs= df.shift() # Shift df by one row
dfs = dfs.rename(columns={'Name': 'Nameshifted'})

df_combined = pd.concat([df,dfs],axis=1) # combine original and shifted df
df_combined = df_combined.fillna('') # remove NaNs

for index, row in df_combined.iterrows():
    df_combined.loc[index,'Ratio'] = (Levenshtein.ratio(row['Name'], row['Nameshifted']))
    df_combined.loc[index,'Distance'] = (Levenshtein.distance(row['Name'], row['Nameshifted']))

print(df_combined) |
import pandas as pd
import Levenshtein
df = pd.read_excel('Daten.xlsx')
df = df.sort_values(by=['Name'])
df = df.reset_index(drop=True)
dfs= df.shift() # Shift df by one row
dfs = dfs.rename(columns={'Name': 'Nameshifted'})
df_combined = pd.concat([df,dfs],axis=1) # combine original and shifted df
df_combined = df_combined.fillna('') # remove NaNs
for index, row in df_combined.iterrows():
df_combined.loc[index,'Ratio'] = (Levenshtein.ratio(row['Name'], row['Nameshifted']))
df_combined.loc[index,'Distance'] = (Levenshtein.distance(row['Name'], row['Nameshifted']))
print(df_combined)
Als Ergebnis erhält man dann einen Dataframe, der die sortierten Namen miteinander vergleicht und die Levenshtein-Ratio sowie die Levenshtein-Distanz ausgibt.
|
Name |
Nameshifted |
Ratio |
Distance |
| 0 |
Ambacher |
|
0.000000 |
8.0 |
| 1 |
Bertram |
Ambacher |
0.266667 |
8.0 |
| 2 |
Cderick |
Bertram |
0.285714 |
6.0 |
| 3 |
Cedrick |
Cderick |
0.857143 |
2.0 |
| 4 |
Dorn |
Cedrick |
0.181818 |
6.0 |
| 5 |
Elba |
Dorn |
0.000000 |
4.0 |
| 6 |
Friedrich |
Elba |
0.000000 |
9.0 |
| 7 |
Gastav |
Friedrich |
0.000000 |
9.0 |
| 8 |
Gustav |
Gastav |
0.833333 |
1.0 |
| 9 |
Horn |
Gustav |
0.000000 |
6.0 |
| 10 |
Immenweg |
Horn |
0.166667 |
7.0 |
| 11 |
Klaas |
Immenweg |
0.000000 |
8.0 |
| 12 |
Klaus |
Klaas |
0.800000 |
1.0 |
Bei hoher Ratio oder kleiner Distanz sollte man sich die Werte anschauen.
Hinweis: Ich bin hier davon ausgegangen, dass nur im Namen der nächsten Zeile ein Dreher auftreten kann. Vergleicht man alle n Namen mit allen anderen n-1 Namen, so wird es schnell aufwändig und zeitintensiv.
Uwe Ziegenhagen likes LaTeX and Python, sometimes even combined.
Do you like my content and would like to thank me for it? Consider making a small donation to my local fablab, the Dingfabrik Köln. Details on how to donate can be found here Spenden für die Dingfabrik.
More Posts - Website
2022-03-20, 22:41
Über eine Verknüpfung auf die Rundll32.exe kann man flink in den Energiesparmodus von Windows wechseln.
In irgendeinem Ordner (z.B. auf dem Desktop) rechte Maustaste => neu => Verknüpfung. Als Speicherort des Elements dann folgendes eingeben:
C:\Windows\System32\rundll32.exe powrprof.dll,SetSuspendState
Uwe Ziegenhagen likes LaTeX and Python, sometimes even combined.
Do you like my content and would like to thank me for it? Consider making a small donation to my local fablab, the Dingfabrik Köln. Details on how to donate can be found here Spenden für die Dingfabrik.
More Posts - Website
2022-03-19, 20:52
Hier noch ein weiteres Beispiel, wie man sich mit Python sinnlose manuelle Arbeiten erleichtern kann. Gegeben sei die folgende Verzeichnisstruktur:
Verzeichnis1
 Ordner1
  Unterordner1
   Willich.txt
 Ordner2
  Unterordner2
   Willich.txt
 Ordner3
  Unterordner3
   Willich.txt
Die in den Ordnern liegenden Dateien sind alle gleich benannt (trotz unterschiedlicher Inhalte), sollen aber für die weitere Verarbeitung in einen Ordner verschoben werden. Man kann sie jetzt manuell nach dem Schema „Ordnerx-Unterordnerx-Dateiname“ umbenennen, man kann es aber auch lassen und ein kurzes Python-Skript dazu schreiben. Spätestens bei 20 oder 30 Dateien lohnt sich der Aufwand der initialen Entwicklung, das Beispiel lässt sich auch leicht auf andere Aufgaben übertragen. Die folgende Python-Datei speichert man in „Verzeichnis1“, dieses Verzeichnis bildet dann den root-Pfad. Der Rest ist dann einfach nur cleveres Auswerten des Pfades und das Wechseln der Backslashes in Unterstriche, um den neuen Pfad zu bauen.
import os

for (root,dirs,files) in os.walk('.'):

    for file in files:
        fullpath = os.path.join(root,file)

        if fullpath.endswith('.txt'):
            newpath = root+'\\'+root[2:].replace('\\','_')+'_'+file
            print(newpath)
os.rename(fullpath, newpath) |
import os
for (root,dirs,files) in os.walk('.'):
for file in files:
fullpath = os.path.join(root,file)
if fullpath.endswith('.txt'):
newpath = root+'\\'+root[2:].replace('\\','_')+'_'+file
print(newpath)
os.rename(fullpath, newpath)
Uwe Ziegenhagen likes LaTeX and Python, sometimes even combined.
Do you like my content and would like to thank me for it? Consider making a small donation to my local fablab, the Dingfabrik Köln. Details on how to donate can be found here Spenden für die Dingfabrik.
More Posts - Website
2022-03-19, 20:20
Vor kurzem hatte ich die Herausforderung, diverse XML Dateien zu kombinieren, die aufgrund einer Größenbeschränkung in einzelne, jeweils eigenständige, Dateien zerlegt worden waren. In jeder Datei fanden sich XML-Metaangaben in den ersten zwei und der letzten Zeile. Die Aufgabe bestand nun darin, den XML-Kopf und das XML-Ende nur einmal in der Ausgabedatei zu haben. An der folgenden Text-Datei kann man das gut erkennen:
Will ich nur einmal am Anfang
Will ich nur einmal am Anfang
Will ich
Will ich
Will ich
Will ich
Will ich
Will ich nur einmal am Ende
Mit Python ging es dann recht einfach, elegant und ausreichend performant (3 jeweils über 100 MB große Dateien ließen sich in ungefähr 12 Sekunden kombinieren):
- Die zu kombinierenden Dateien speichere ich in einem Array, hinzu kommt die Angabe des Ausgabepfads. Diese Information könnte man gegebenenfalls auch aus dem Dateisystem holen.
- Wir öffnen die Ausgabedatei zum Schreiben
- und nutzen dann ein enumerate, um den Zähler zu bekommen, bei welcher Datei wir gerade sind
- Bearbeiten wir die erste Datei, so brauchen wir alles bis auf die letzte Zeile
- Bearbeiten wir die letzte Datei, so brauchen wir nicht die ersten beiden Zeilen
- Bei den Dateien 2 bis n-1 brauchen wir weder die ersten zwei noch die letzte Zeile
files = ['f:/willich.txt', 'f:/willich.txt',  'f:/willich.txt']

output = 'F:/kombiniert.txt'
filecount = len(files)

print(f'Processing {filecount} files')

with open(output, 'w') as outputfile: # Ausgabe öffnen

    for counter, file in enumerate(files):
        print(counter, file)

        with open(file, 'r') as fin:
            data = fin.read().splitlines(True)

        if counter == 0: # Erste Datei: alles bis auf die letzte Zeile
            outputfile.writelines(data[:-1])

        elif counter == filecount - 1: # letzte Datei, alles bis auf die ersten zwei Zeilen
            outputfile.writelines(data[2:])

        else: # die Dateien zwischen erster und letzter Datei, nicht die beiden ersten und die letzte Zeile
outputfile.writelines(data[2:-1]) |
files = ['f:/willich.txt', 'f:/willich.txt', 'f:/willich.txt']
output = 'F:/kombiniert.txt'
filecount = len(files)
print(f'Processing {filecount} files')
with open(output, 'w') as outputfile: # Ausgabe öffnen
for counter, file in enumerate(files):
print(counter, file)
with open(file, 'r') as fin:
data = fin.read().splitlines(True)
if counter == 0: # Erste Datei: alles bis auf die letzte Zeile
outputfile.writelines(data[:-1])
elif counter == filecount - 1: # letzte Datei, alles bis auf die ersten zwei Zeilen
outputfile.writelines(data[2:])
else: # die Dateien zwischen erster und letzter Datei, nicht die beiden ersten und die letzte Zeile
outputfile.writelines(data[2:-1])
Uwe Ziegenhagen likes LaTeX and Python, sometimes even combined.
Do you like my content and would like to thank me for it? Consider making a small donation to my local fablab, the Dingfabrik Köln. Details on how to donate can be found here Spenden für die Dingfabrik.
More Posts - Website
2022-03-05, 22:24
Mit dem folgenden Schnipsel kann man den Pfad der Python.exe bestimmen, die das aktuelle Programm ausführt
import sys
print(sys.executable) |
import sys
print(sys.executable)
Uwe Ziegenhagen likes LaTeX and Python, sometimes even combined.
Do you like my content and would like to thank me for it? Consider making a small donation to my local fablab, the Dingfabrik Köln. Details on how to donate can be found here Spenden für die Dingfabrik.
More Posts - Website
2021-12-23, 20:35
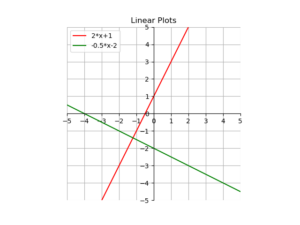
Hier ein kurzes Beispiel, wie man mit matplotlib Funktionen plotten kann.
import matplotlib.pyplot as plt
import numpy as np

ax = plt.gca()
plt.gca().set_aspect('equal')

ax.set_xticks(range(-6,6,1))
ax.set_yticks(range(-6,6,1))
ax.set_xlim([-5, 5])
ax.set_ylim([-5, 5])

ax.spines['top'].set_color('none')
ax.spines['bottom'].set_position('zero')
ax.spines['left'].set_position('zero')
ax.spines['right'].set_color('none')

x = np.linspace(-5,5,100)
y = 2*x+1
y2 = -0.5*x-2

plt.plot(x, y,  'r', label='2*x+1')
plt.plot(x, y2, 'g', label='-0.5*x-2')

plt.title('Linear Plots')

plt.legend(loc='upper left')

plt.grid()
plt.show() |
import matplotlib.pyplot as plt
import numpy as np
ax = plt.gca()
plt.gca().set_aspect('equal')
ax.set_xticks(range(-6,6,1))
ax.set_yticks(range(-6,6,1))
ax.set_xlim([-5, 5])
ax.set_ylim([-5, 5])
ax.spines['top'].set_color('none')
ax.spines['bottom'].set_position('zero')
ax.spines['left'].set_position('zero')
ax.spines['right'].set_color('none')
x = np.linspace(-5,5,100)
y = 2*x+1
y2 = -0.5*x-2
plt.plot(x, y, 'r', label='2*x+1')
plt.plot(x, y2, 'g', label='-0.5*x-2')
plt.title('Linear Plots')
plt.legend(loc='upper left')
plt.grid()
plt.show()
Uwe Ziegenhagen likes LaTeX and Python, sometimes even combined.
Do you like my content and would like to thank me for it? Consider making a small donation to my local fablab, the Dingfabrik Köln. Details on how to donate can be found here Spenden für die Dingfabrik.
More Posts - Website
2021-12-23, 20:14
Angenommen, wir haben eine Excel-Datei Daten.xlsx mit Werten, die in ein entsprechendes XML-Dokument überführt werden müssen.
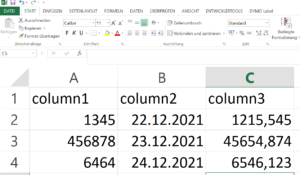
Mit Python und der Jinja2 Template-Engine ist das flink gemacht. Zuerst definieren wir das Template template.xml:
<?xml version='1.0' encoding='UTF-8'?>
	<table name="Tablename">
	{% for _,row in data.iterrows() %}
	<ROW>
    <COLUMN1>{{row['column1']}}</COLUMN1>
    <COLUMN2>{{row['column2']}}</COLUMN2>
    <COLUMN3>{{row['column3']}}</COLUMN3>
	</ROW>
	{% endfor %}
</table> |
<?xml version='1.0' encoding='UTF-8'?>
<table name="Tablename">
{% for _,row in data.iterrows() %}
<ROW>
<COLUMN1>{{row['column1']}}</COLUMN1>
<COLUMN2>{{row['column2']}}</COLUMN2>
<COLUMN3>{{row['column3']}}</COLUMN3>
</ROW>
{% endfor %}
</table>
Dann definieren wir den Python-Code:
import pandas as pd # data wrangling
import jinja2 # template engine
import os # for file-related stuff

# create jinja env that can load template from filesystem
jinja_env = jinja2.Environment(loader = jinja2.FileSystemLoader(os.path.abspath('.')))

df = pd.read_excel('Daten.xlsx')
template = jinja_env.get_template('template.xml')

with open('FertigesXML.xml','w') as output:
output.write(template.render(data=df)) |
import pandas as pd # data wrangling
import jinja2 # template engine
import os # for file-related stuff
# create jinja env that can load template from filesystem
jinja_env = jinja2.Environment(loader = jinja2.FileSystemLoader(os.path.abspath('.')))
df = pd.read_excel('Daten.xlsx')
template = jinja_env.get_template('template.xml')
with open('FertigesXML.xml','w') as output:
output.write(template.render(data=df))
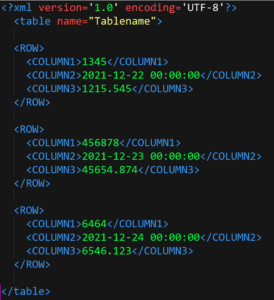
Lassen wir den Python-Code laufen, so erhalten wir das folgende XML:
Uwe Ziegenhagen likes LaTeX and Python, sometimes even combined.
Do you like my content and would like to thank me for it? Consider making a small donation to my local fablab, the Dingfabrik Köln. Details on how to donate can be found here Spenden für die Dingfabrik.
More Posts - Website