Scatterplots mit Python und Seaborn
- Scatterplots mit Python und Seaborn
- Mehr zu Scatterplots mit Seaborn
- Stripplots mit Seaborn
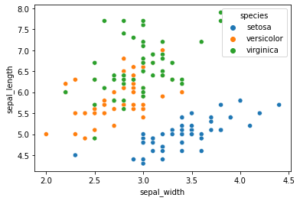
Hier ein einfaches Beispiel für einen Scatterplot mit Python und dem Seaborn Modul. Das Beispiel nutzt den bekannten Iris-Datensatz von R. Fisher, der gut für Klassifikationstechniken genutzt werden kann.
import seaborn as sns iris=sns.load_dataset('iris') sns.scatterplot(x=iris['sepal_width'],y=iris['sepal_length'],hue=iris['species']) |