Mit Seaborn lassen sich auch Stripplots erstellen, hier ein Beispiel. Die Besonderheit ist hier, dass die pd.melt() Funktion genutzt wird, um aus den verschiedenen Variablen des Datensatzes drei Variablen zu machen: eine für den Typ echt/unecht, eine für den Variablennamen und eine für den Wert der jeweiligen Variablen.
#!/usr/bin/env python
# coding: utf-8

import seaborn as sns
import pandas as pd
import requests
from bs4 import BeautifulSoup
from io import StringIO
import matplotlib.pylab as plt

headers = {
    'Access-Control-Allow-Origin': '*',
    'Access-Control-Allow-Methods': 'GET',
    'Access-Control-Allow-Headers': 'Content-Type',
    'Access-Control-Max-Age': '3600',
    'User-Agent': 'Mozilla/5.0 (X11; Ubuntu; Linux x86_64; rv:52.0) Gecko/20100101 Firefox/52.0'
}

url = "http://www.statistics4u.com/fundstat_eng/data_fluriedw.html"
req = requests.get(url, headers)
soup = BeautifulSoup(req.content, 'html.parser')


data=soup.find('pre').contents[0]

str_object = StringIO(data)

df = pd.read_csv(str_object,engine='python',skiprows=5,delim_whitespace=True)

# Banknotes BN1 to BN100 are genuine, all others are counterfeit
df['Type'] = 'Counterfeit'
df.loc[df.index[:100], 'Type'] = 'Genuine'

print(df)

sns.set(style="whitegrid", palette="muted")

#df = df[['Left', 'Diagonal', 'Type']]
df = pd.melt(df, "Type", var_name="Variable")

sp = sns.stripplot(x="value",
              y="Variable",
              hue="Type",
              data=df,
              dodge=True,
              alpha=.75,
              zorder=1)

#sp.set(xlim=(127, 143))

sp.legend_.remove()
plt.show() |
#!/usr/bin/env python
# coding: utf-8
import seaborn as sns
import pandas as pd
import requests
from bs4 import BeautifulSoup
from io import StringIO
import matplotlib.pylab as plt
headers = {
'Access-Control-Allow-Origin': '*',
'Access-Control-Allow-Methods': 'GET',
'Access-Control-Allow-Headers': 'Content-Type',
'Access-Control-Max-Age': '3600',
'User-Agent': 'Mozilla/5.0 (X11; Ubuntu; Linux x86_64; rv:52.0) Gecko/20100101 Firefox/52.0'
}
url = "http://www.statistics4u.com/fundstat_eng/data_fluriedw.html"
req = requests.get(url, headers)
soup = BeautifulSoup(req.content, 'html.parser')
data=soup.find('pre').contents[0]
str_object = StringIO(data)
df = pd.read_csv(str_object,engine='python',skiprows=5,delim_whitespace=True)
# Banknotes BN1 to BN100 are genuine, all others are counterfeit
df['Type'] = 'Counterfeit'
df.loc[df.index[:100], 'Type'] = 'Genuine'
print(df)
sns.set(style="whitegrid", palette="muted")
#df = df[['Left', 'Diagonal', 'Type']]
df = pd.melt(df, "Type", var_name="Variable")
sp = sns.stripplot(x="value",
y="Variable",
hue="Type",
data=df,
dodge=True,
alpha=.75,
zorder=1)
#sp.set(xlim=(127, 143))
sp.legend_.remove()
plt.show()
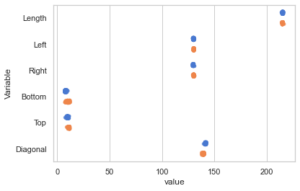
Das Bild, was dabei erzeugt wird, ist aber eher schlecht. Da die Variablen teilweise sehr unterschiedliche Skalen haben, erkennt man eigentlich nur Punktwolken, die übereinander liegen.
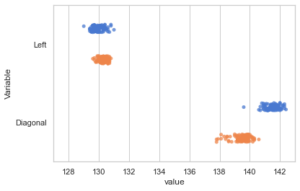
Die Lösung besteht darin, nur die Variablen gemeinsam zu plotten, die sehr nah beieinander liegende Skalen haben. Dazu entfernt man die beiden Hashes aus den auskommentierten Python-Zeilen, um nur noch die Variablen Left und Diagonal zu plotten und um die Skale anzupassen.
Dann erkennt man im Bild, dass die Diagonale echte und falsche Banknoten schön voneinander trennt.
Uwe Ziegenhagen likes LaTeX and Python, sometimes even combined.
Do you like my content and would like to thank me for it? Consider making a small donation to my local fablab, the Dingfabrik Köln. Details on how to donate can be found here Spenden für die Dingfabrik.
More Posts - Website