2019-06-19, 21:26
Mit Openpyxl lassen sich auch einfach Excel-Daten in Kalkulationstabellen umwandeln, die eine ansprechende Formatierung, Unterstützung bei Formeln und Filter mitbringen. Im folgenden Beispiel nutzen wir noch die Hilfsfunktion get_column_letter(ws.max_column) aus dem utils.cell Modul, um den Excel-Spaltenname für die entsprechenden Spalten zu bestimmen.
import pandas as pd
import numpy as np
from openpyxl import Workbook
from openpyxl.utils.cell import get_column_letter
from openpyxl.utils.dataframe import dataframe_to_rows
from openpyxl.worksheet.table import Table, TableStyleInfo


dataframe = pd.DataFrame(np.array([[1, 2, 3], [4, 5, 6], [7, 8, 9]]), columns=['a', 'b', 'c'])
rows = dataframe_to_rows(dataframe, index=False, header=True)

wb = Workbook()
ws = wb.active

for r_idx, row in enumerate(rows, 1):
    for c_idx, value in enumerate(row, 1):
        ws.cell(row=r_idx, column=c_idx, value=value)

# Set column widths based on title width or fixed number
widths = {}
for column in ws.columns:
    if column[0].value is None: # no column header => Fixed with
        widths[column[0].column] = 10.5
    else: # if column header is present => min width resp. maximum
        widths[column[0].column] = max(len(str(column[0].value)) * 1.45, 10.5)

ws.column_dimensions[get_column_letter(column[0].column)].width = widths[column[0].column]

# Insert formatted table from A1 to max column/max row
tab = Table(displayName="MeineTabelle", ref='A1:' + get_column_letter(ws.max_column) + str(ws.max_row))
style = TableStyleInfo(name="TableStyleLight9", showFirstColumn=False,
                       showLastColumn=False, showRowStripes=True, showColumnStripes=True)
tab.tableStyleInfo = style
ws.add_table(tab)

wb.save('05.xlsx')
wb.close() |
import pandas as pd
import numpy as np
from openpyxl import Workbook
from openpyxl.utils.cell import get_column_letter
from openpyxl.utils.dataframe import dataframe_to_rows
from openpyxl.worksheet.table import Table, TableStyleInfo
dataframe = pd.DataFrame(np.array([[1, 2, 3], [4, 5, 6], [7, 8, 9]]), columns=['a', 'b', 'c'])
rows = dataframe_to_rows(dataframe, index=False, header=True)
wb = Workbook()
ws = wb.active
for r_idx, row in enumerate(rows, 1):
for c_idx, value in enumerate(row, 1):
ws.cell(row=r_idx, column=c_idx, value=value)
# Set column widths based on title width or fixed number
widths = {}
for column in ws.columns:
if column[0].value is None: # no column header => Fixed with
widths[column[0].column] = 10.5
else: # if column header is present => min width resp. maximum
widths[column[0].column] = max(len(str(column[0].value)) * 1.45, 10.5)
ws.column_dimensions[get_column_letter(column[0].column)].width = widths[column[0].column]
# Insert formatted table from A1 to max column/max row
tab = Table(displayName="MeineTabelle", ref='A1:' + get_column_letter(ws.max_column) + str(ws.max_row))
style = TableStyleInfo(name="TableStyleLight9", showFirstColumn=False,
showLastColumn=False, showRowStripes=True, showColumnStripes=True)
tab.tableStyleInfo = style
ws.add_table(tab)
wb.save('05.xlsx')
wb.close()
Uwe Ziegenhagen likes LaTeX and Python, sometimes even combined.
Do you like my content and would like to thank me for it? Consider making a small donation to my local fablab, the Dingfabrik Köln. Details on how to donate can be found here Spenden für die Dingfabrik.
More Posts - Website
2019-06-19, 21:20
Wir im letzten Teil erwähnt, lassen sich die Spaltenbreiten beim Export nach Excel auch errechnen. Dazu dient der Schnipsel von stackoverflow im folgenden Code. Ich habe den Code noch so abgewandelt, dass — wenn eine Spaltenüberschrift vorhanden ist — das Maximum aus dem Produkt der errechneten Breite und einem händisch festgelegten Faktor und einer fixen Zahl genutzt wird.
import pandas as pd
import numpy as np
from openpyxl import Workbook
from openpyxl.utils.dataframe import dataframe_to_rows

dataframe = pd.DataFrame(np.array([[1, 2, 3], [4, 5, 6], [7, 8, 9]]), columns=['a', 'b', 'c'])
rows = dataframe_to_rows(dataframe, index=False, header=True)

wb = Workbook()
ws = wb.active

for r_idx, row in enumerate(rows, 1):
    for c_idx, value in enumerate(row, 1):
        ws.cell(row=r_idx, column=c_idx, value=value)

# Set column widths based on title width or fixed number
widths = {}
for column in ws.columns:
    if column[0].value is None: # no column header => Fixed with
        widths[column[0].column] = 10.5
    else: # if column header is present => min width resp. maximum
        widths[column[0].column] = max(len(str(column[0].value)) * 1.45, 10.5)

ws.column_dimensions[get_column_letter(column[0].column)].width = widths[column[0].column]

wb.save('04.xlsx')
wb.close() |
import pandas as pd
import numpy as np
from openpyxl import Workbook
from openpyxl.utils.dataframe import dataframe_to_rows
dataframe = pd.DataFrame(np.array([[1, 2, 3], [4, 5, 6], [7, 8, 9]]), columns=['a', 'b', 'c'])
rows = dataframe_to_rows(dataframe, index=False, header=True)
wb = Workbook()
ws = wb.active
for r_idx, row in enumerate(rows, 1):
for c_idx, value in enumerate(row, 1):
ws.cell(row=r_idx, column=c_idx, value=value)
# Set column widths based on title width or fixed number
widths = {}
for column in ws.columns:
if column[0].value is None: # no column header => Fixed with
widths[column[0].column] = 10.5
else: # if column header is present => min width resp. maximum
widths[column[0].column] = max(len(str(column[0].value)) * 1.45, 10.5)
ws.column_dimensions[get_column_letter(column[0].column)].width = widths[column[0].column]
wb.save('04.xlsx')
wb.close()
Uwe Ziegenhagen likes LaTeX and Python, sometimes even combined.
Do you like my content and would like to thank me for it? Consider making a small donation to my local fablab, the Dingfabrik Köln. Details on how to donate can be found here Spenden für die Dingfabrik.
More Posts - Website
2019-06-19, 21:14
Mit openpyxl lassen sich auch die Spaltenbreiten für einzelne Spalten explizit festlegen. Dazu liefert das worksheet Objekt die Eigenschaft column_dimensions mit, die man einfach setzen kann. Dieses manuelle Setzen kann man auch weglassen, wenn man die Spaltenbreite errechnen lässt, dazu mehr im nächsten Teil.
import pandas as pd
import numpy as np
from openpyxl import Workbook
from openpyxl.utils.dataframe import dataframe_to_rows

dataframe = pd.DataFrame(np.array([[1, 2, 3], [4, 5, 6], [7, 8, 9]]), columns=['a', 'b', 'c'])
rows = dataframe_to_rows(dataframe, index=False, header=True)

wb = Workbook()
ws = wb.active

for r_idx, row in enumerate(rows, 1):
    for c_idx, value in enumerate(row, 1):
        ws.cell(row=r_idx, column=c_idx, value=value)

ws.column_dimensions['A'].width = 5
ws.column_dimensions['B'].width = 10
ws.column_dimensions['C'].width = 15

wb.save('03.xlsx')
wb.close() |
import pandas as pd
import numpy as np
from openpyxl import Workbook
from openpyxl.utils.dataframe import dataframe_to_rows
dataframe = pd.DataFrame(np.array([[1, 2, 3], [4, 5, 6], [7, 8, 9]]), columns=['a', 'b', 'c'])
rows = dataframe_to_rows(dataframe, index=False, header=True)
wb = Workbook()
ws = wb.active
for r_idx, row in enumerate(rows, 1):
for c_idx, value in enumerate(row, 1):
ws.cell(row=r_idx, column=c_idx, value=value)
ws.column_dimensions['A'].width = 5
ws.column_dimensions['B'].width = 10
ws.column_dimensions['C'].width = 15
wb.save('03.xlsx')
wb.close()
Uwe Ziegenhagen likes LaTeX and Python, sometimes even combined.
Do you like my content and would like to thank me for it? Consider making a small donation to my local fablab, the Dingfabrik Köln. Details on how to donate can be found here Spenden für die Dingfabrik.
More Posts - Website
2019-06-19, 21:10
Wichtiger als das manuelle Schreiben von Excel-Dateien ist für mich das Umwandeln von pandas Dataframes in Excel-Dateien.
Hier das passende Beispiel dazu, wie man einen Dataframe in eine Excel-Datei exportiert.
import pandas as pd
import numpy as np
from openpyxl import Workbook
from openpyxl.utils.dataframe import dataframe_to_rows

dataframe = pd.DataFrame(np.array([[1, 2, 3], [4, 5, 6], [7, 8, 9]]), columns=['a', 'b', 'c'])
rows = dataframe_to_rows(dataframe, index=False, header=True)

wb = Workbook()
ws = wb.active

for r_idx, row in enumerate(rows, 1):
    for c_idx, value in enumerate(row, 1):
        ws.cell(row=r_idx, column=c_idx, value=value)

wb.save('02.xlsx')
wb.close() |
import pandas as pd
import numpy as np
from openpyxl import Workbook
from openpyxl.utils.dataframe import dataframe_to_rows
dataframe = pd.DataFrame(np.array([[1, 2, 3], [4, 5, 6], [7, 8, 9]]), columns=['a', 'b', 'c'])
rows = dataframe_to_rows(dataframe, index=False, header=True)
wb = Workbook()
ws = wb.active
for r_idx, row in enumerate(rows, 1):
for c_idx, value in enumerate(row, 1):
ws.cell(row=r_idx, column=c_idx, value=value)
wb.save('02.xlsx')
wb.close()
Uwe Ziegenhagen likes LaTeX and Python, sometimes even combined.
Do you like my content and would like to thank me for it? Consider making a small donation to my local fablab, the Dingfabrik Köln. Details on how to donate can be found here Spenden für die Dingfabrik.
More Posts - Website
2017-03-20, 20:14
Durch eine SX Frage bin ich auf das Verfahren der „Russischen Bauernmultiplikation“ gestoßen, mit der man ohne Multiplikation ganzzahlige Zahlen miteinander multiplizieren kann. Just for Fun hier die Python-Implementierung:
# -*- coding: utf-8 -*-
"""
Created on Sat Mar 18 10:04:40 2017

@author: Uwe Ziegenhagen
"""
import pandas as pd
from math import floor

def russianPeasantMultiply(a, b):
    assert a > 1
    assert b > 0
    data = pd.DataFrame([[a, b]], columns=list('ab'))
    while a > 1:
        a = floor(a/2)
        b = b + b
        data.loc[len(data)]=[a, b]
    data = data[data['a'] % 2 == 1]
    return(data.b.sum())

print(russianPeasantMultiply(63, 17)) |
# -*- coding: utf-8 -*-
"""
Created on Sat Mar 18 10:04:40 2017
@author: Uwe Ziegenhagen
"""
import pandas as pd
from math import floor
def russianPeasantMultiply(a, b):
assert a > 1
assert b > 0
data = pd.DataFrame([[a, b]], columns=list('ab'))
while a > 1:
a = floor(a/2)
b = b + b
data.loc[len(data)]=[a, b]
data = data[data['a'] % 2 == 1]
return(data.b.sum())
print(russianPeasantMultiply(63, 17))
Ohne pandas geht es sicher auch, aber pandas macht es etwas einfacher…
Uwe Ziegenhagen likes LaTeX and Python, sometimes even combined.
Do you like my content and would like to thank me for it? Consider making a small donation to my local fablab, the Dingfabrik Köln. Details on how to donate can be found here Spenden für die Dingfabrik.
More Posts - Website
2017-03-12, 09:38
Hier ein kurzes Beispiel, wie man mittels melt bestimmte Daten in die richtige Form bekommt.
Ausgangspunkt ist der folgende Datensatz:
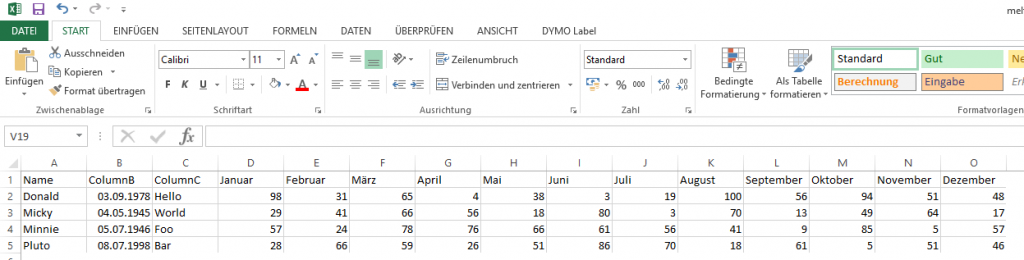
Zum Auswerten ist der nicht optimal, ich möchte die Monatswerte gern untereinander haben. Mittels melt geht das ganz einfach:
# -*- coding: utf-8 -*-

import pandas as pd

data = pd.read_excel('meltdata.xlsx')

print(data.shape[1], 'columns and', data.shape[0], 'rows')

print(list(data))

melted = pd.melt(data, id_vars=['Name', 'ColumnB', 'ColumnC'],
                 value_vars=['Januar', 'Februar', 'März', 'April', 'Mai',
                 'Juni', 'Juli', 'August', 'September', 'Oktober',
                 'November', 'Dezember'])

print(melted) |
# -*- coding: utf-8 -*-
import pandas as pd
data = pd.read_excel('meltdata.xlsx')
print(data.shape[1], 'columns and', data.shape[0], 'rows')
print(list(data))
melted = pd.melt(data, id_vars=['Name', 'ColumnB', 'ColumnC'],
value_vars=['Januar', 'Februar', 'März', 'April', 'Mai',
'Juni', 'Juli', 'August', 'September', 'Oktober',
'November', 'Dezember'])
print(melted)
      Name    ColumnB ColumnC   variable  value

0   Donald 1978-09-03   Hello     Januar     98

1    Micky 1945-05-04   World     Januar     29

2   Minnie 1946-07-05     Foo     Januar     57

3    Pluto 1998-07-08     Bar     Januar     28

4   Donald 1978-09-03   Hello    Februar     31

5    Micky 1945-05-04   World    Februar     41

6   Minnie 1946-07-05     Foo    Februar     24

...
Uwe Ziegenhagen likes LaTeX and Python, sometimes even combined.
Do you like my content and would like to thank me for it? Consider making a small donation to my local fablab, the Dingfabrik Köln. Details on how to donate can be found here Spenden für die Dingfabrik.
More Posts - Website
2016-08-24, 21:27
Here are my slides from the Froscon 2016 presentation „Using Python for Scientific Research“.
Slides: Froscon_Slides_2016
Video: Video Recording (The screen was flickering most of the time, pretty annoying and distracting)
I will continously update and expand this presentation during the next months, if you want to receive updates follow the GitHub repository: https://github.com/UweZiegenhagen/2016-Python-Data-Analysis-Slides/
Uwe Ziegenhagen likes LaTeX and Python, sometimes even combined.
Do you like my content and would like to thank me for it? Consider making a small donation to my local fablab, the Dingfabrik Köln. Details on how to donate can be found here Spenden für die Dingfabrik.
More Posts - Website
2016-02-28, 21:29
I recently came across a „challenge“ where I needed to combine various rows. Each row was identified by Key1 and Key2 and had two interesting columns, Foo and Bar. For each Key1 there may be a few Key2, for each Key2 n Foo/Bar entries. While all Foos are distinct per Key1 and Key2 the Bar column may appear j times.
The goal was to get a list of unique Bar items for each Key1/Key2 combination.
|
Key1 |
Key2 |
Foo |
Bar |
| 0 |
C1 |
T1 |
a1 |
rc-1 |
| 1 |
C1 |
T1 |
a2 |
rc-1 |
| 2 |
C1 |
T1 |
a3 |
rc-1 |
| 3 |
C1 |
T1 |
a4 |
rc-1 |
| 4 |
C2 |
T2 |
b1 |
rc-1 |
| 5 |
C2 |
T2 |
b2 |
rc-2 |
| 6 |
C3 |
T3 |
c1 |
rc-3 |
| 7 |
C4 |
T4 |
d1 |
rc-4 |
| 8 |
C4 |
T4 |
d2 |
rc-5 |
| 9 |
C4 |
T4 |
d3 |
rc-4 |
The following Python code nicely did the job, thanks to http://stackoverflow.com/questions/17841149/pandas-groupby-how-to-get-a-union-of-strings
# -*- coding: utf-8 -*-
import pandas as pd

def unique(liste):
    """ takes a list of elements, separated by comma and returns sorted string of unique items separated by comma """
    a = liste.split(',')
    b = sorted(set(a))
    return ','.join(b)

df = pd.read_excel('groupb_Beispiel.xlsx')
print(df)

grouped = df.groupby(['Key1','Key2'],as_index=False)['Bar'].agg(lambda col: ','.join(col))
grouped = pd.DataFrame(grouped)

grouped['Unique'] = grouped['Bar'].apply(unique)

print(grouped)

grouped.to_excel('result.xlsx') |
# -*- coding: utf-8 -*-
import pandas as pd
def unique(liste):
""" takes a list of elements, separated by comma and returns sorted string of unique items separated by comma """
a = liste.split(',')
b = sorted(set(a))
return ','.join(b)
df = pd.read_excel('groupb_Beispiel.xlsx')
print(df)
grouped = df.groupby(['Key1','Key2'],as_index=False)['Bar'].agg(lambda col: ','.join(col))
grouped = pd.DataFrame(grouped)
grouped['Unique'] = grouped['Bar'].apply(unique)
print(grouped)
grouped.to_excel('result.xlsx')
|
Key1 |
Key2 |
Bar |
Unique |
| 0 |
C1 |
T1 |
rc-1,rc-1,rc-1,rc-1 |
rc-1 |
| 1 |
C2 |
T2 |
rc-1,rc-2 |
rc-1,rc-2 |
| 2 |
C3 |
T3 |
rc-3 |
rc-3 |
| 3 |
C4 |
T4 |
rc-4,rc-5,rc-4 |
rc-4,rc-5 |
Uwe Ziegenhagen likes LaTeX and Python, sometimes even combined.
Do you like my content and would like to thank me for it? Consider making a small donation to my local fablab, the Dingfabrik Köln. Details on how to donate can be found here Spenden für die Dingfabrik.
More Posts - Website
2016-02-03, 22:02
Hier meine Folien zum Data Science Meetup vom 29.01.2016.
Pandas (PDF)
Uwe Ziegenhagen likes LaTeX and Python, sometimes even combined.
Do you like my content and would like to thank me for it? Consider making a small donation to my local fablab, the Dingfabrik Köln. Details on how to donate can be found here Spenden für die Dingfabrik.
More Posts - Website
2016-01-27, 22:10
Vor einiger Zeit hatte ich eine Excel-Datei zu bearbeiten, in der in einer Spalte die Spaltennamen, in einer anderen die korrespondieren Werte standen. Immer drei Zeilen bildeten den eigentlichen Datensatz. Mit wenigen Zeilen Pandas und cleverer Adressierung der Ergebnis-Zelle.
| Spaltenname |
Wert |
| ColA |
Andi |
| ColB |
Berni |
| ColC |
Cesar |
| ColA |
Dorian |
| ColB |
Ernest |
| ColC |
Frank |
import pandas as pd

# Lade die Daten
daten = pd.read_excel('combine.xlsx')
# Erstelle leeren Dataframe mit den Spaltennamen aus den Excelzeilen
verarbeitet = pd.DataFrame(columns=['ColA','ColB','ColC'])

# Iteriere über die Daten
for i, row in daten.iterrows():
    # ganzzahliges Teilen, um die Zeile zu bestimmen
    # in die die Zelle gehört, Spalte ergibt sich aus dem Wert in 'Spalte'
    verarbeitet.loc[i // 3,row['Spalte']] = row['Wert']

print(verarbeitet) |
import pandas as pd
# Lade die Daten
daten = pd.read_excel('combine.xlsx')
# Erstelle leeren Dataframe mit den Spaltennamen aus den Excelzeilen
verarbeitet = pd.DataFrame(columns=['ColA','ColB','ColC'])
# Iteriere über die Daten
for i, row in daten.iterrows():
# ganzzahliges Teilen, um die Zeile zu bestimmen
# in die die Zelle gehört, Spalte ergibt sich aus dem Wert in 'Spalte'
verarbeitet.loc[i // 3,row['Spalte']] = row['Wert']
print(verarbeitet)
|
ColA |
ColB |
ColC |
| 0 |
Andi |
Berni |
Cesar |
| 1 |
Dorian |
Ernest |
Frank |
Nachtrag: Stephan vom Kölner Data Science Meetup hat mir noch einen alternativen Weg gezeigt:
import pandas as pd

data = {'A': ["cola", "colb", "colc", "cola", "colb", "colc"], "B": [1, 2, 3, 4, 5, 6]}
data = pd.DataFrame(data)
gb = data.groupby('A')
res = pd.DataFrame()
for key in gb.groups:
    res[key] = gb.get_group(key)['B'].values.flatten()

print(res) |
import pandas as pd
data = {'A': ["cola", "colb", "colc", "cola", "colb", "colc"], "B": [1, 2, 3, 4, 5, 6]}
data = pd.DataFrame(data)
gb = data.groupby('A')
res = pd.DataFrame()
for key in gb.groups:
res[key] = gb.get_group(key)['B'].values.flatten()
print(res)
Uwe Ziegenhagen likes LaTeX and Python, sometimes even combined.
Do you like my content and would like to thank me for it? Consider making a small donation to my local fablab, the Dingfabrik Köln. Details on how to donate can be found here Spenden für die Dingfabrik.
More Posts - Website